Driver-Demand Equilibrium (D²E Framework)
- Smital Kamdi
- Nov 6, 2025
- 6 min read

Updated: Nov 6, 2025
In last-mile logistics, customer satisfaction hinges on timely, reliable, and cost-efficient service delivery. However, fluctuating demand patterns, uneven driver distribution, and attrition create persistent mismatches between supply (driver availability) and demand (delivery requests).
This project introduces a data-driven strategy and metric system to dynamically align drivers with demand hotspots through predictive analytics, operational interventions, and continuous optimization.

Goal
To design, test, and optimize an Adaptive Driver Allocation Framework (D²E) that:
Maximizes service reliability and customer satisfaction (CSAT, On-Time Rate)
Minimizes idle driver time, cancellation rate, and average delivery time
Balances short-term supply-demand gaps with long-term driver retention and operational stability
Problem
In dynamic last-mile delivery systems, driver-demand imbalance causes:
Missed or delayed deliveries: Lead to poor customer experience, higher churn.
Inefficient driver utilization: Drivers idle in low-demand zones while high-demand zones remain underserved.
Increased operational costs: Extra travel for repositioning, wasted fuel, and higher incentives.
Attrition loops: Drivers in low-earning areas leave, worsening the imbalance further.
Objectives
Objective | Description | Expected Outcome |
1. Predict Demand | Use historical trip data to forecast hourly/region-wise delivery demand. | 85%+ demand forecast accuracy |
2. Model Driver Supply | Analyze active driver count and distribution by region and hour. | Identify high/low availability zones |
3. Optimize Allocation Strategy | Recommend driver repositioning, incentive, and scheduling policies. | Reduction in unserved demand |
4. Measure Operational Health | Create composite metrics that tie efficiency to CSAT and cost. | Build a Driver-Demand Equilibrium Score (DDES) |
Metrics
Metric | Formula | Insight | Goal |
Demand Fulfillment Ratio (DFR) | Completed Deliveries/ Total Requests | Measures how well supply meets demand. | ≥ 0.95 |
Driver Utilization Rate (DUR) | Active Delivery Time/(Total Logged-in Time) | Measures productivity of driver base. | ≥ 0.85 |
Service Latency Index (SLI) | Actual ETA - Promised ETA | Captures customer-perceived timeliness. | ≤ 1.1 |
Driver-Demand Equilibrium Score (DDES) | αDFR + βDUR + γSLI (Weighted composite of DFR, DUR, SLI) | Single KPI to track operational health. | ≥ 0.9 |
Strategy Playbook
Horizon | Strategy Type | Example Actions |
Short-Term (Reactive) | Dynamic Incentivization | Offer surge pay or bonuses for underserved zones during high demand. |
Real-Time Rebalancing | Send reposition prompts to idle drivers within 3–5 miles of a hotspot. | |
Micro-Batching | Group nearby deliveries to improve utilization during demand peaks. | |
Mid-Term (Predictive) | Demand Forecasting Model | Use historical and contextual features (hour, day, weather, events) to predict demand. |
Driver Supply Simulation | Estimate active supply using driver engagement & attrition data. | |
Long-Term (Strategic) | Driver Retention & Distribution | Optimize driver onboarding and retention programs in underserved areas. |
Geo-Expansion Planning | Identify emerging demand zones to pre-position drivers and marketing spend. |
Contingency Plan
Challenge | Symptom | Counter-Strategy |
Low driver response to incentives | DFR remains low even after surge pay | Introduce gamified bonuses, or flexible shift scheduling |
Over-saturation in nearby zones | Idle time spikes in adjacent regions | Apply zonal rotation limits or auto-reposition triggers |
Forecast model drift | Demand predictions lose accuracy | Implement rolling retraining and real-time data refresh |
Attrition due to fatigue or pay | Churn rate rises | Improve driver experience program and minimum earnings guarantee |
Scaling the Framework
Automation Layer (Agentic AI)
Monitor Agent: Tracks DDES weekly and triggers alerts when any region falls below the threshold.
Diagnosis Agent: Evaluates the imbalance cause as it can possibly be because of any of the reasons like demand surge, attrition, or incentive inefficiency.
Execution Agent: Suggests corrective action (e.g., increase surge incentive by 5% for 2 hours).
Cross-Market Scalability
Start with one pilot city and then expand to multi-city dashboards.
Localize model weights (e.g., w₁ for DFR more important in dense cities, w₂ for DUR in suburban areas).
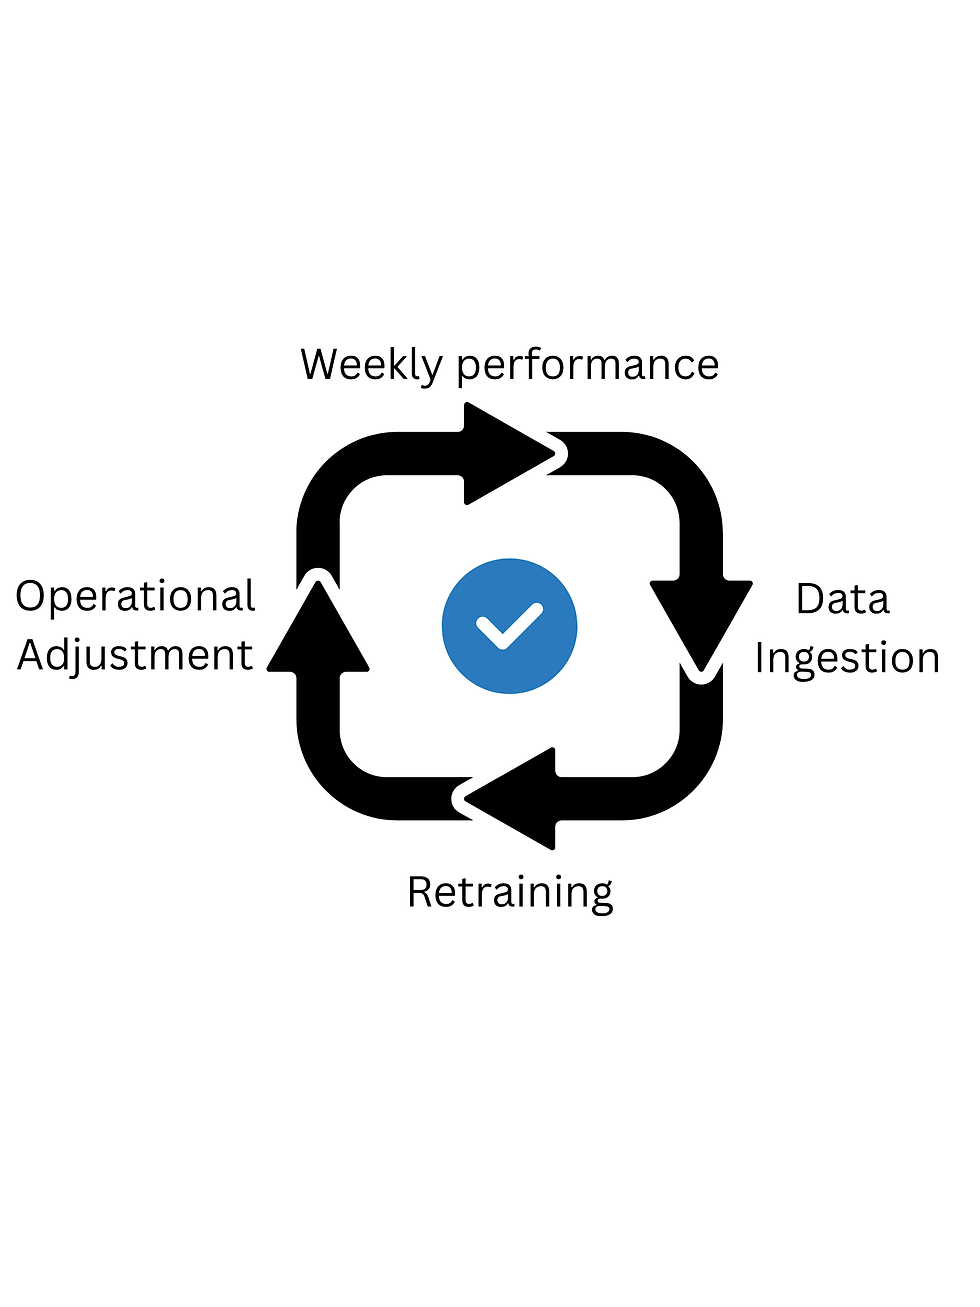
Continuous Feedback Loop
Results & Insights
The Adaptive Driver Allocation Framework (D²E) was tested using historical delivery and driver activity data to assess supply-demand alignment, service reliability, and operational efficiency across multiple urban and suburban regions. The results reveal clear regional and temporal patterns that validate the model’s practical relevance.
1. Regional Performance: Average DDES by Region
The Driver–Demand Equilibrium Score (DDES) serves as a composite measure of operational health, combining demand fulfillment, driver utilization, and service latency.
The analysis showed that:
Regional Sector B achieved the highest DDES (~0.78), indicating a strong equilibrium between driver availability and delivery requests.
Suburban Hubs A and B followed closely with consistent, reliable performance reflecting efficient resource allocation and stable driver engagement.
Metro Core zones and Campus/Business Parks scored moderately (around 0.68–0.70), suggesting slight inefficiencies likely caused by congestion, traffic delays, or demand surges during commuting hours.

Regional performance comparison showing that suburban and regional sectors maintain higher (DDES), indicating stronger alignment between driver availability and delivery demand compared to dense metro zones. Key takeaway: Peripheraland suburban areas maintain steadier operational balance than dense metro zones, which require more frequent interventions to stabilize performance.
2. Temporal Patterns: DFR by Hour and Region
The Demand Fulfillment Ratio (DFR) heatmap uncovered distinct hourly trends across regions:
During early morning hours (0 – 5 AM), all regions maintained high DFR values due to limited demand.
Between 6 AM and 10 AM, fulfillment dropped notably in Metro Core areas, signaling mismatches between driver start times and morning order spikes.
Afternoon to evening (12 – 8 PM) hours also displayed lower DFR in Metro and Campus zones, aligning with peak demand and slower turnaround times.
Suburban regions demonstrated more uniform DFR throughout the day, benefiting from consistent trip density and balanced driver availability.

Heatmap illustrating hourly Demand Fulfillment Ratios (DFR) across regions. Metro and campus zones experience noticeable dips during morning and evening peaks, revealing key time windows for targeted driver rebalancing. Key takeaway: Time-sensitive operational levers, such as dynamic incentives or proactive driver repositioning, should focus on Metro and Campus zones during morning and evening peaks to sustain high fulfillment levels.
3. Relationship Between Efficiency and Timeliness: DFR vs SLI
A strong inverse correlation emerged between the Demand Fulfillment Ratio (DFR) and the Service Latency Index (SLI): as DFR improved (approaching 1.0), SLI consistently decreased. This relationship confirms that better fulfillment efficiency directly leads to reduced delivery delays and higher customer satisfaction. Regions or time windows with lower DFR exhibited noticeably higher SLI, reflecting slower service and unmet demand pockets.

Scatter plot demonstrating the inverse relationship between Demand Fulfillment Ratio (DFR) and Service Latency Index (SLI). As fulfillment improves, delivery delays decline, highlighting the direct link between operational efficiency and customer satisfaction Key takeaway: Strengthening supply-demand alignment not only improves efficiency metrics but also enhances the end-user experience through faster and more reliable delivery performance.
Overall Interpretation
The D²E framework successfully demonstrated how data-driven monitoring can capture both operational health and customer experience through composite indicators like DDES.By visualizing these insights:
Managers can identify underperforming zones or hours in real time,
Prioritize driver incentives and scheduling adjustments, and
Quantify how small interventions influence broader delivery reliability.
Together, these findings confirm that adaptive, metric-driven decision-making can sustainably balance efficiency, cost, and satisfaction in last-mile logistics.
Explore the Code
Curious to see the full data-driven workflow behind this project?
Access the source code on GitHub
These resources include the complete dataset pipeline, SQL schema, visualization scripts, and operational metrics dashboard used to generate the results in this post.
Next Steps & Future Work
Building on these insights, the next phase of the D²E Framework will focus on automation, scalability, and continuous learning. The goal is to transform static analysis into a self-optimizing operational system that can react, learn, and adapt in real time.
1. Real-Time Monitoring Dashboard: Integrate DFR, SLI, and DDES metrics into a live dashboard that tracks regional and hourly trends. This will allow operations teams to visualize performance dips, driver imbalances, and demand surges as they happen.
2. Predictive Allocation Engine: Develop a forecasting model that uses historical patterns, weather, local events, and driver behavior to predict demand spikes 1–3 hours in advance, enabling proactive repositioning of drivers before congestion occurs.
3. Agentic Automation Layer: Implement an AI-driven, multi-agent system composed of:
Monitor Agent: Flags underperforming regions when DDES falls below a defined threshold.
Diagnosis Agent: Identifies the root cause (e.g., demand surge, low driver availability, or incentive inefficiency).
Execution Agent: Recommends or automates corrective actions—like increasing surge pay, adjusting shift schedules, or notifying nearby idle drivers.
4. Cross-Market Expansion: Scale the system across multiple cities by fine-tuning model weights for local dynamics, e.g., prioritizing DFR in dense urban areas versus DUR in suburban regions. This localized calibration ensures the framework remains adaptive to different delivery environments.
In summary, the D²E project demonstrates how structured data, operational playbooks, and predictive analytics can work together to solve one of the hardest challenges in last-mile logistics, achieving equilibrium between driver supply and delivery demand. The next iteration of this system will bring the vision closer to reality: a self-learning, automated equilibrium engine that keeps every delivery efficient, timely, and sustainable.


Comments